Sheet # 842

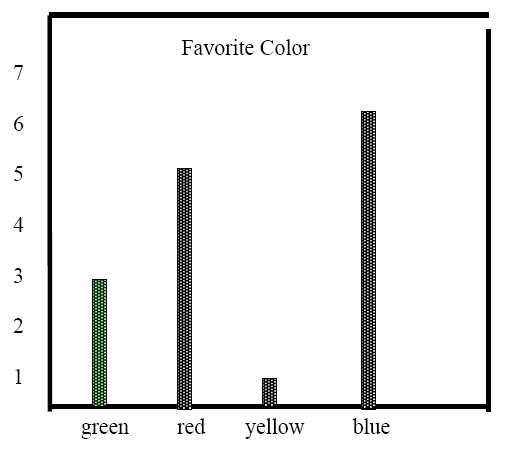
1. What was the favorite color of the children?
a. yellow
b. green
c. red
d. blue
2. How many more children chose red than green?
b. 3
c. 5
d. 8
3. How many children chose yellow as their favorite color?
b. 3
c. 5
d. 6
4. How many tallies are in the box below?

b. 23
c. 28
d. 43
Use the weather graph below to answer question #5 and #6?

5. How many sunny days were there?
b. 4
c. 3
d. 1
6. How many sunny and rainy days were there?
Use the calendar to answer questions #7-9
January

7. What day of the week did January 1st fall on?
b. Tuesday
c. Friday
d. Saturday
8. What was the date of the 2nd Friday in January?
b. 12th
c. 19th
d. 26th
9. How many days were there in January?
b. 30
c. 29
d. 28
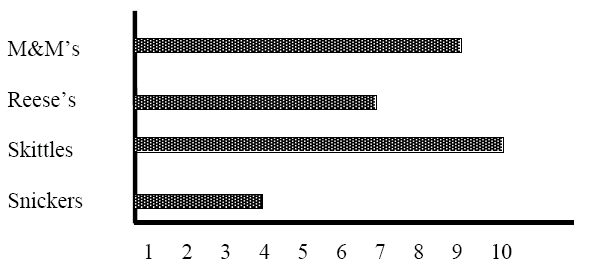
Use the graph below to answer question #10-12

10. What kind of candy did the least amount of children like?
b. Reese's
c. Skittles
d. Snickers
11. How many children chose M & M's as their favorite candy?
b. 7
c. 10
d. 9
12. What kind of candy did 10 children like?
a. M & M's
b. Reese's
c. Skittles
d. Snickers
13. Who had the most balloons?

a. Logan and Janelle
b. Kelly and Janelle
c. Logan and Max
d. Janelle and Max
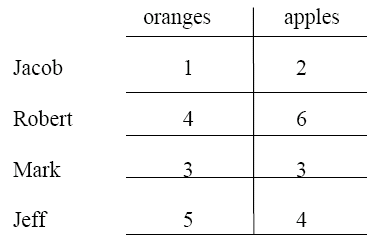
The following table shows how many apples and oranges the boys ate.

14. Who ate the most apples?
a. Jacob
b. Robert
c. Mark
d. Jeff