Explain and Show Your Work.
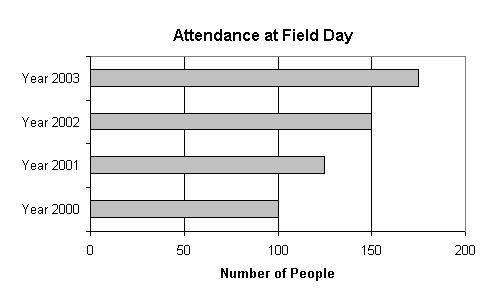
The graph below shows how many people attended Downey School Field Day for each of the last four years.

Sheet # 675
Name_________________________Date:_____________
Explain and Show Your Work.
The graph below shows how many people attended Downey School Field Day for each of the last four years. 
1) What was the total attendance in 4 year?
2) If the trend shown on this graph continues, about how many people will attend the field day event in year 2004?
Answers for sheet # 675
1) 100 + 125 + 150 + 175 = 550 persons
2) Add 25. It will be 200 persons.